Observability allows administrators to monitor workspace health and troubleshoot issues by analyzing system-generated data. This guide covers the two primary signals used in Rocket.Chat: Logs and Metrics.
From Rocket.Chat 8.0, the built‑in Logs Viewer (previously available at Workspace > Reports > Logs) was removed. Logging is now handled entirely at the infrastructure level. As a result, we recommend configuring a dedicated observability stack.
In this guide, you’ll learn :
Why use an observability stack?
By using a dedicated observability stack, you gain:
Persistence: Logs remain available even if containers crash, restart, or are updated.
Correlation: Compare Rocket.Chat logs side-by-side with MongoDB events or other services.
Advanced Querying: Use powerful query languages (like LogQL) to filter by userId, errorCode, or specific timestamps across millions of entries instantly.
Configure an observability stack
Rocket.Chat’s official Docker Compose and Helm chart includes a recommended observability stack for monitoring your workspace that can be easily enabled during deployment. This stack uses:
Prometheus to collect workspace metrics
Loki to collect and index workspace logs
Grafana to easily visualize logs and metrics through dashboards
Configuring the recommended observability stack depends on your deployment method and whether you are performing a new installation or updating an existing workspace.
Configure observability in new deployments
If you are setting up a fresh workspace, follow the respective monitoring guides for your deployment method:
Configure observability in existing deployments
If you already have a workspace running but need to add Loki logs support to your current monitoring setup, follow these instructions for Kubernetes:
Update your Helm chart:
helm upgrade monitoring rocketchat/monitoring \
  -f values-monitoring.yaml \
  -n rocketchat \
Once the pods restart, log in to Grafana to view the new Rocket.Chat Logs dashboard.
Configure logs and metrics output
While visualization happens in Grafana, workspace administrators can control what Rocket.Chat emits by adjusting log and prometheus settings.
Navigate to Manage ![]() > Workspace > Settings > Logs to access the log settings. For detailed configuration options, refer to the Configure Workspace Logs guide.
> Workspace > Settings > Logs to access the log settings. For detailed configuration options, refer to the Configure Workspace Logs guide.
Access workspace logs
Logs record individual events that occur in the workspace, such as errors, warnings, or system actions. They are essential for investigating errors, diagnosing performance issues, and understanding unexpected behavior.
In the recommended observability stack, logs are collected by Loki and visualized in Grafana. You can access them via the Grafana dashboard or directly through your runtime environment.
Option 1: Via Grafana dashboard (recommended)
Log in to your Grafana instance.
Navigate to Dashboards and select the
rocketchatdashboard.Click on Rocket.Chat Logs.
A dashboard appears showing time‑ordered logs from your workspace.
To filter the results:
Use the time picker in the top-right corner to filter results by specific durations.
Click the Refresh icon to pull the latest entries.
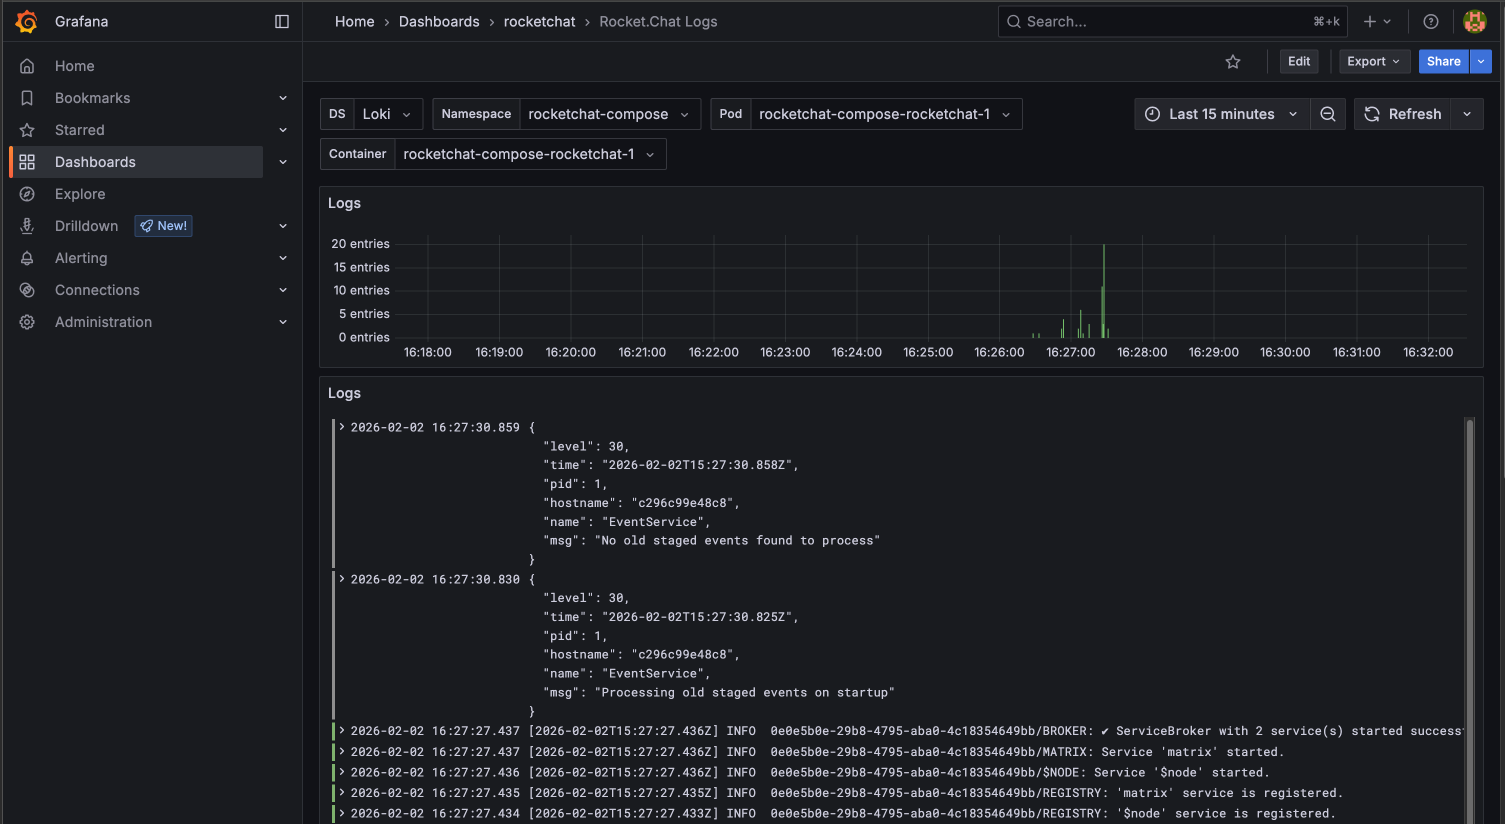
Grafana Logs Dashboard
If the dashboard is empty, review the dropdown selections at the top of the page. Ensure the Data Source (DS), Namespace, and Pod selections match your current deployment.
Option 2: Via runtime (CLI)
Rocket.Chat writes logs to standard output (stdout) in your deployment server. How you access these logs depends on how Rocket.Chat is deployed.
Follow the guide for your deployment method:
Access workspace metrics
Metrics are numerical measurements collected over time, such as resource usage or request counts. They show trends and system behavior, helping you assess the health and performance of the workspace.
The recommended monitoring stack uses Promethus to collect metrics and visualizes them in a Grafana dashboard.
To access workspace metrics:
Log in to your Grafana instance.
Navigate to Dashboards and select the
rocketchatdashboard.Click on Rocket.Chat Metrics.
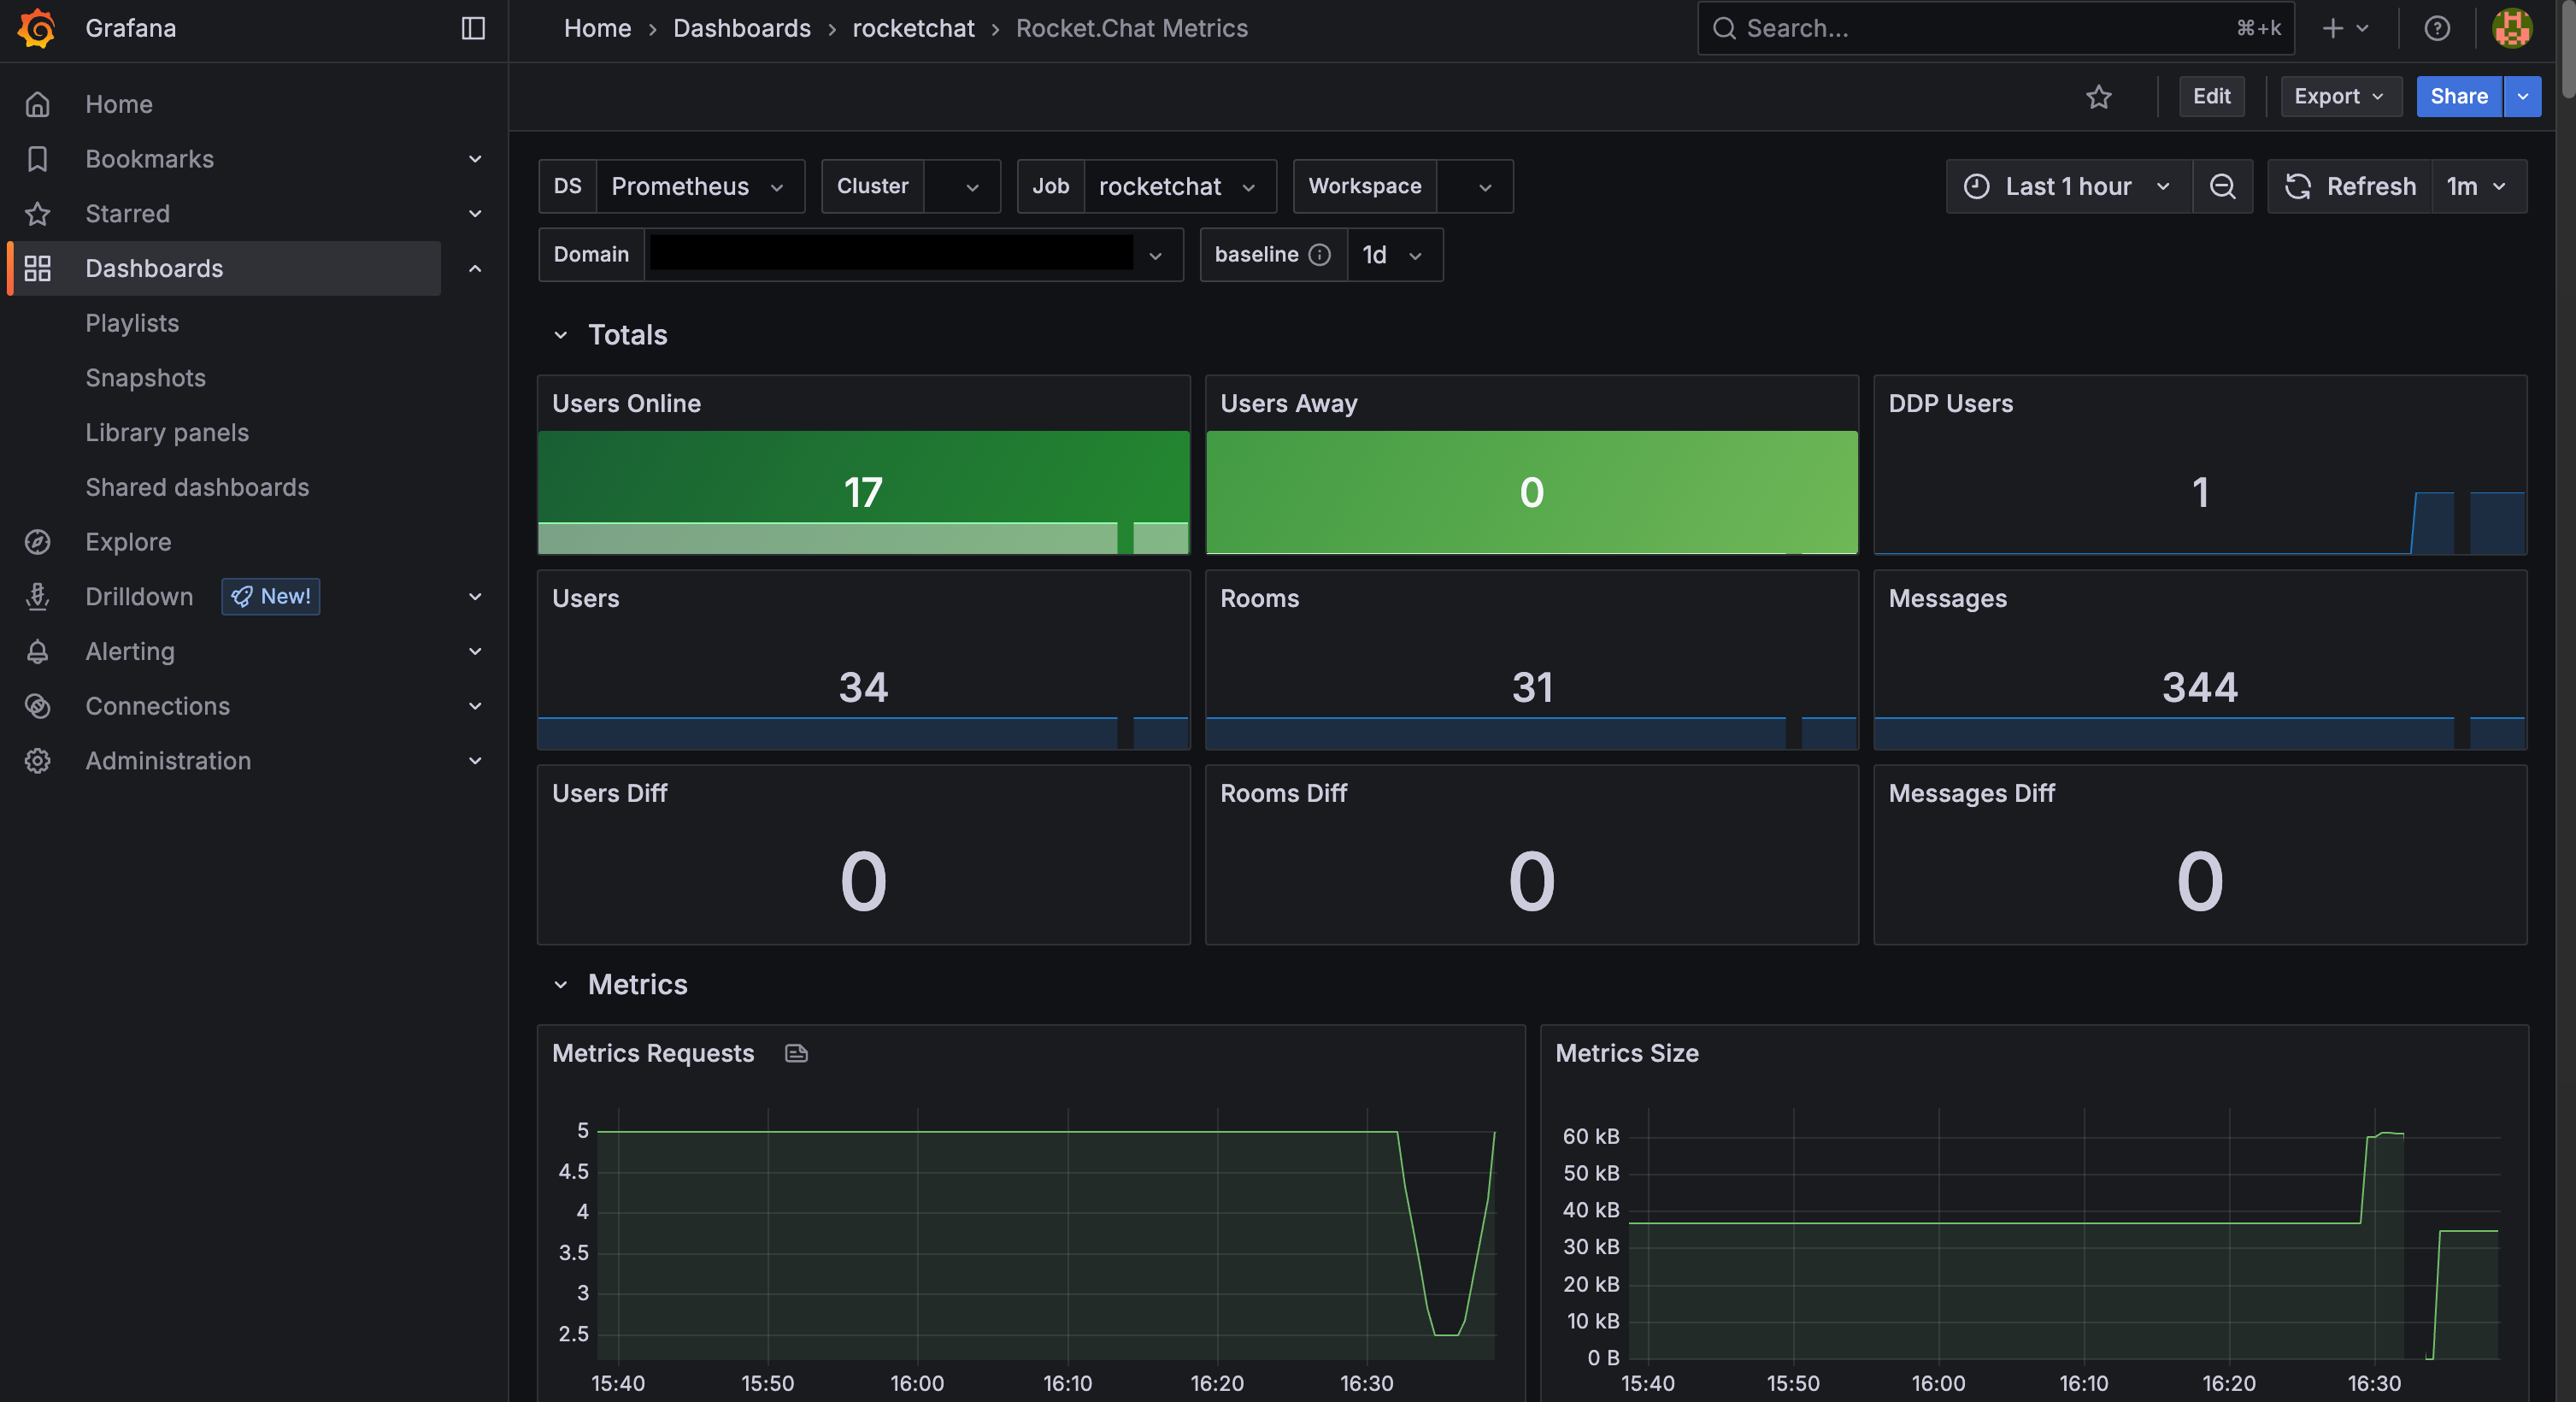
A dashboard appears showing charts and graphs for your workspace metrics.
To filter the results:
Use the time picker at the top right to filter results by specific durations.
Click the Refresh icon to pull the latest entries.
Now that you have observability configured, you are better equipped to monitor and maintain a healthy Rocket.Chat environment.